Can your recruitment data do this?
Collating and analysing your recruitment data is essential. It’s essential for measuring your ROI, securing internal buy-in, identifying problem areas and making improvements.
But how do you evolve a list of figures on a page into an accessible and insightful analysis? This is where data visualisations (i.e. graphs, charts, heat maps and more) can bring your statistics to life.
Clarifying results
We all know the clarity a simple bar graph can provide. Suddenly, your lengthy table has become a revealing diagram, showing you which areas are excelling, and which need more support.
A visual such as this doesn’t take long to take in – unlike a complex numerical analysis, a graph or chart can be understood instantly. Your results are now clear and concise.
Spotting patterns
It’s much easier to spot trends in your data when you have clear, visual results.
For example, are you struggling to attract talent in certain departments? Or is your cost-per-hire much higher in some of your offices than others?
Being able to realise these patterns can be the key to discovering gaps or problem areas in your strategies. And, most importantly, they can set you on the path to solving them.
Perhaps you need to reassess your recruitment advertising to address the talent shortage, or invest in technology to lower your overall recruitment spend?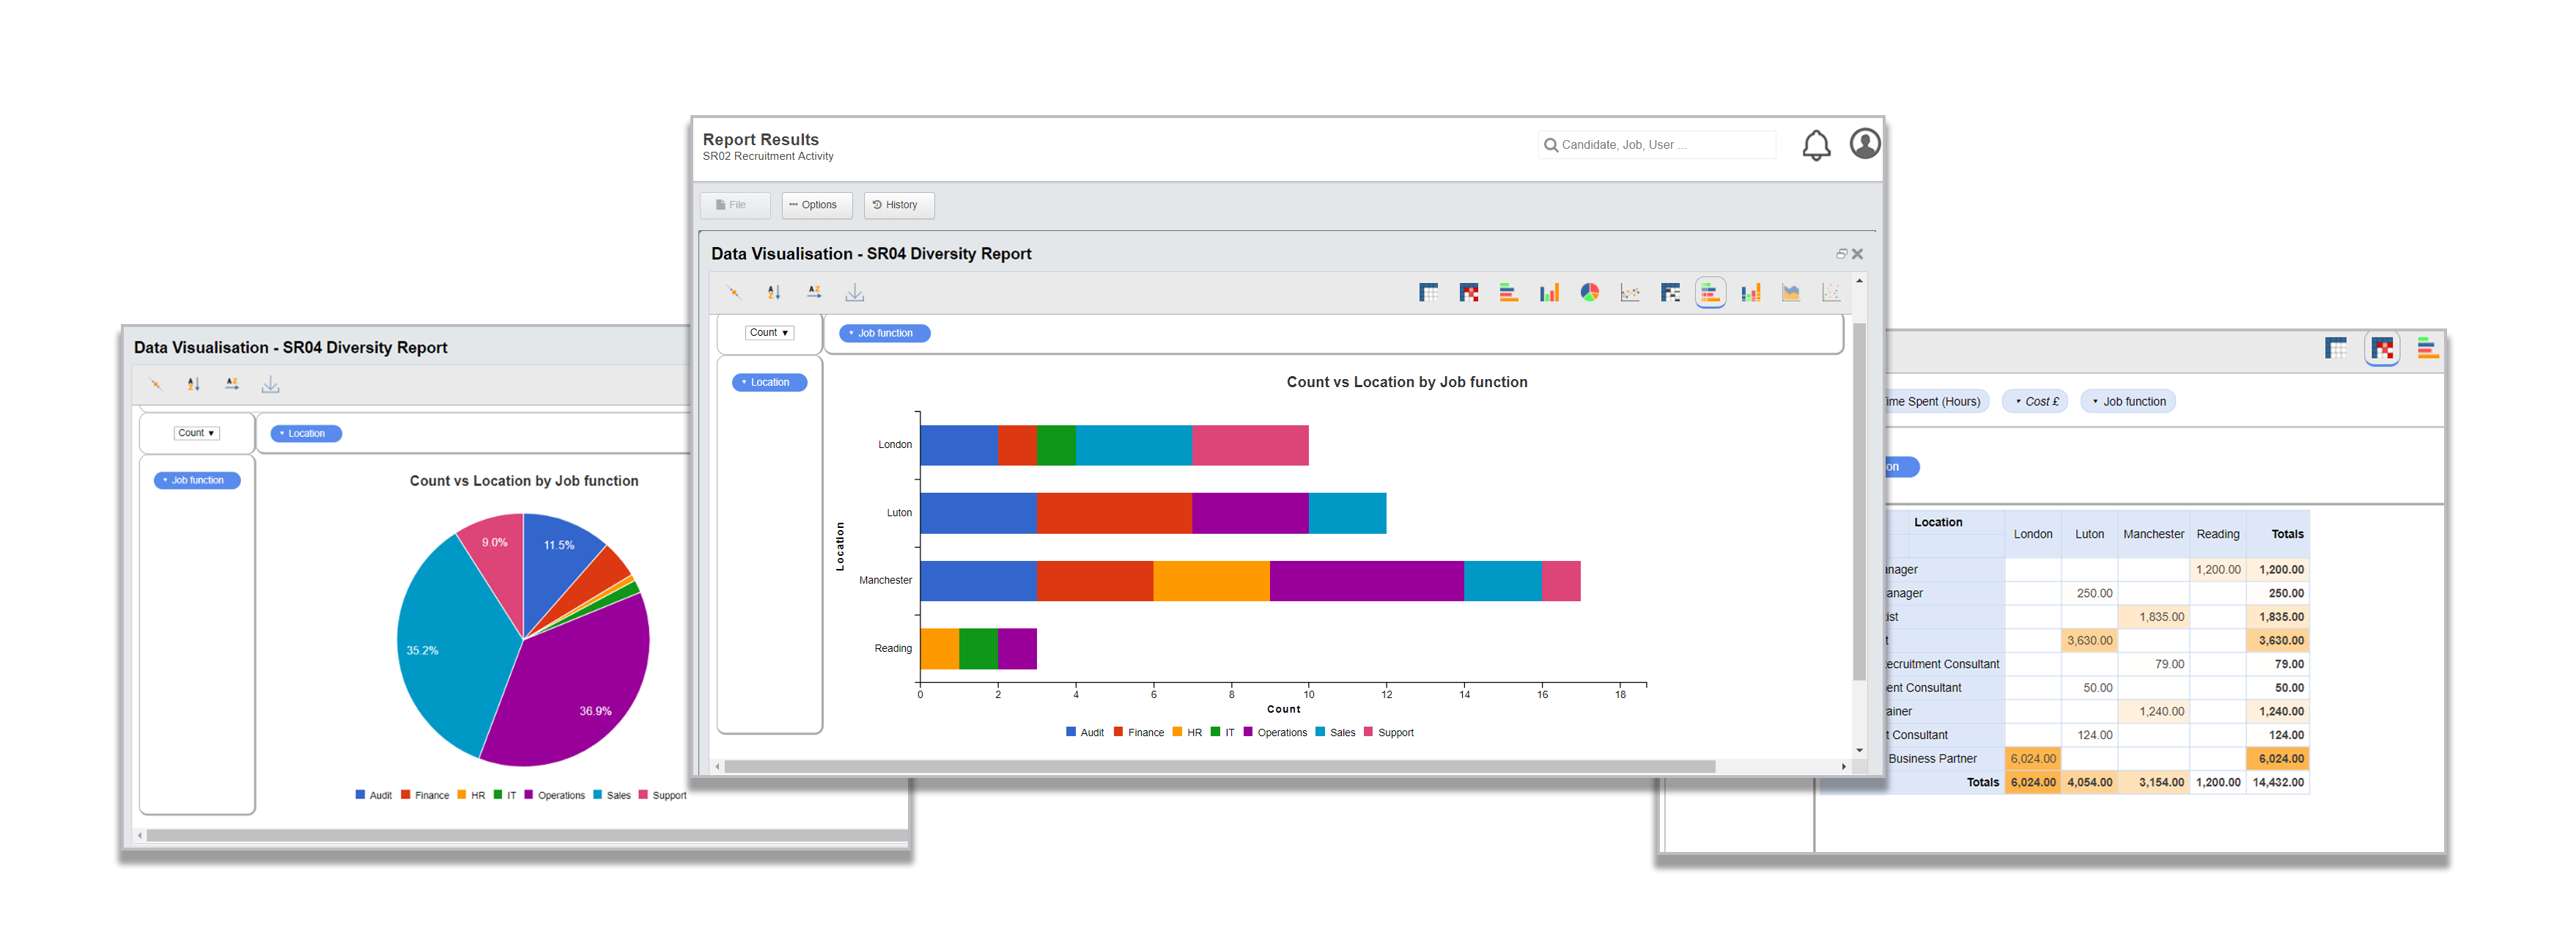
Making an impact
Now you have a clear idea of what your data means, and what you can be doing to better your results – but you still need to be able to implement these changes. And that may mean building a business case and securing buy-in.
By converting your recruitment data into graphs and charts, you’ve immediately made it much more impactful, and that means decision makers are more likely sit up and take notice.
Say you’ve noticed that the number of younger people you’re recruiting is decreasing, but you’d like to make a big push to appeal to graduate candidates this year.
Trying a new social platform could strengthen your employer brand and get your vacancies in front of a wider audience, and posting to a new niche job board could allow you to home in on your target market. How can you present a compelling business case and engage decision makers?

Instead of providing them with reams of numbers, which might not mean much to them, try a pie chart to illustrate the shortage of candidates in this age group. Or perhaps a line graph to show them exactly where the peaks and troughs lie. Then, further down the line you can demonstrate the ROI of your new platforms using a source report.
Illustrating your points is a huge step towards making sure your arguments are impactful, and having the evidence needed to hammer your point home.
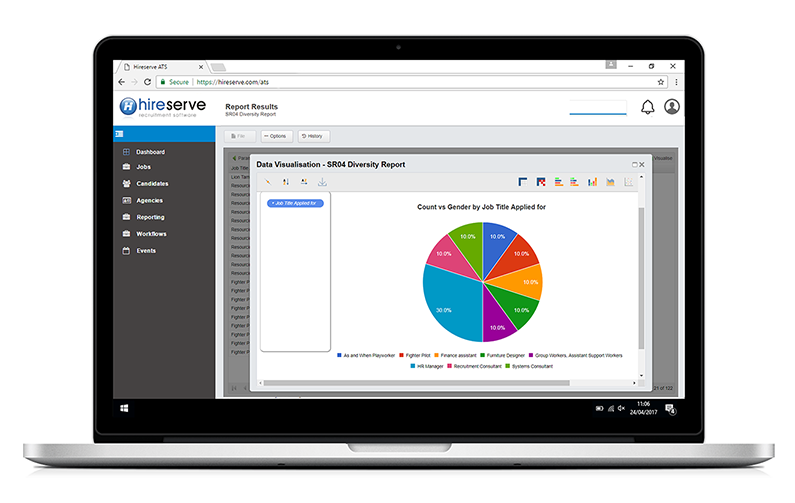
Creating your visuals
With the Hireserve ATS data visualisation tool, you can easily create impactful and revealing graphs and charts, by using the simple drag and drop interface.
You can even change your chart type in the click of a button, and highlight the data you want to drill down into.
Once you’ve settled on your format, you can download your visualisation as an image file, allowing you to drop it into any document you feel works for you.
Find out more about the Hireserve ATS data visualisation tool here
We know that recruitment data is essential, but it’s what you do with it that really counts. Interpreting your data in clear and visual ways can be the difference between a complex group of numbers that don’t really tell you much, to a concise, revealing and impactful analysis of every area of your recruitment.
Find out more
Discover the Hireserve ATS reporting suite
How can reporting help with GDPR compliance?
How Merton Council gained Hiring Manager buy-in with Hireserve ATS

About the author
Tristan Potter
Helen is Hireserve's Communications Executive, planning and executing both external and internal communications, along with a range of other marketing activities. She loves to write about working wellbeing, ATS features and Hireserve news.